Historical Report
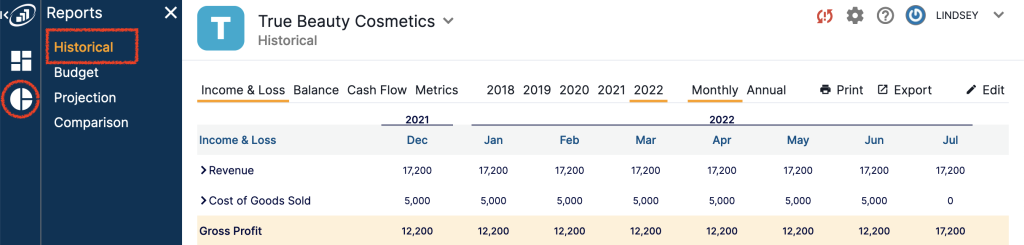
In your AutoCFO app, click on the round icon on the far left (Reports) and then select Historical.
These reports will:
- Help you understand the money your business brought in (Revenue) versus the money that your business spent (expenses)
- Give you a summary of where your cash went (cash flow)
- Give you a summary of your assets (cash and equipment, money people owe you) and your liabilities (debt, the money you owe your vendors and employees)
The Three Main Financial Statements
Income & Loss
How much you Revenue earned and how much you spent by month.
Income / Revenue is broken down into:
- Revenue: Income from your normal business operations (ex: customers)
- Other income: Income from things outside your normal operations (ex: interest income from cash in the bank)
Expenses are broken down into a couple of main categories:
- Cost of Goods Sold: Expenses directly tied to to the goods or services you sell (ex. A smoothie retailer would include the cost of cups, smoothie ingredients and straws, but not marketing expenses)
- Expenses: Expenses that are related to the operation of your business, but not directly tied to each unit of revenue (ex. Payroll (with some exceptions), marketing expenses, rent, utilities. etc.)
Note: There are exceptions to these rules, depending on the industry you are in, for further clarification on why an item is included in Expenses versus Cost of Goods sold, please ask your accounting team!
Balance Sheet
This report is a summary of your assets (cash and equipment, money people owe you) and your liabilities (debt, money you owe your vendors and employees)
Cash Flow
This report is a summary of where your cash went. There are three major sections:
- Cash Flow from operations: Cash earned or spent in you normal business operations
- Cash Flow from investing: Cash earned or spent on long term equipment or research, ex: manufacturing equipment, desks and computers for a new office space
- Cash Flow from financing: Cash from “financing activities”, ie cash from raising debt or equity or cash used to pay down principal portions of debt
Navigating the Historical Reports Dashboard
Time Frame Views

These buttons allow you to select the time frame you want to view. Use these buttons to jump to historic periods. You can also use the scroll arrows on the months bar.
Easter egg! You can use the wheel on your mouse or two fingers on your trackpad (on a laptop) to quickly scroll through months!
Hover over each month and look for the sort arrow, the sort arrow allows you to sort the numbers in each group by dollar value.
Month and Annual Views
These buttons allow you to change the “view” of your report. Select Annual to see the full year of information rather than monthly data.
Tip: You can also select the actual year to switch from monthly to annual and back for just that year.
How to lock a Year in the Month view of any of the Historical Reports:
Want to view just certain months or monthly + annual at the same time?
To lock a year to the current view, select the annual button, lock the year you want to view, then select “monthly” to return to the monthly view, the year you selected will be available in your view. To unpin it simply click the lock icon and it will unpin from the screen.
How to lock a Month in the Annual view of any of the Historical Reports:
Want to see your month numbers plus the whole year at the same time? Switch over to annual, hover over the text “Jan-Dec” and select the lock icon, and then navigate back to the Month view:
Print & Export

Use the Print button to print your report (or use your print function to save it as a PDF). Use the Export button to export your report to a CSV file (and open in Excel, Numbers, etc.)
Edit

This button is AMAZING, if we do say so ourselves. This button allows you to re-order, label, or group your financial data your way! Use terms that make sense to you, group data in a way that helps you make decisions.
If you are focused on marketing spend, group all marketing-related expenses in one category so you don’t have to track down multiple numbers. AutoCFO will calculate the total of all items in that group. Then you can display that group as a tile on your dashboard!
Don’t worry, none of the changes you make here will affect your accounting software. Also, if you are trying to remember what the original line item was labeled in your accounting system (or your accountant wants to know!) hover over the row, and the “source” of the data will pop up.

To reorder a line item, hover over that line item, then select the drag icon to the left of the row title. Then drag the row to where you want it to be.

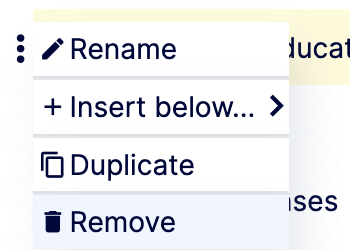
To rename/label a row, select the three dots edit pencil to the left of the row title, then select the pencil icon to rename, and type in your new label, then either select the checkmark or hit your enter key to accept the change


To add a New Group hover over a group or the Expenses row and click on the three dots, then select “+ Insert below...", then select "New Group." This will create a new line group that you can add other items to. Then name the group.,


To add a New Item, hover over a group or the Expenses row and click on the three dots, then select “+ Insert below...", then select "New Item." This will create a new item. Then name the item.
Note: New Item s largely used for budgets. You can add a new row here, however you cannot add numbers / values to historic months.


To delete a group you no longer need:
- First, remove all subcategories from the group by dragging them out of the group using the three stacked lines icon. You cannot delete a group with actual data in it.
- Second, hover over the group (or item) you'd like to delete, and click the three stacked dots icon, then click "Remove" with the trash can icon.
Undo option: If you accidentally make a change, then regret it (who hasn’t??) you can use the “undo” button up to 5 times.

Search Function
Looking for a particular line item? Do a quick search here! This can also help you make sure you don’t have any duplicate categories - if you do, just group them!