In this article, we will walk through the Tile Menu icons in the Dashboard.
Tile Menu
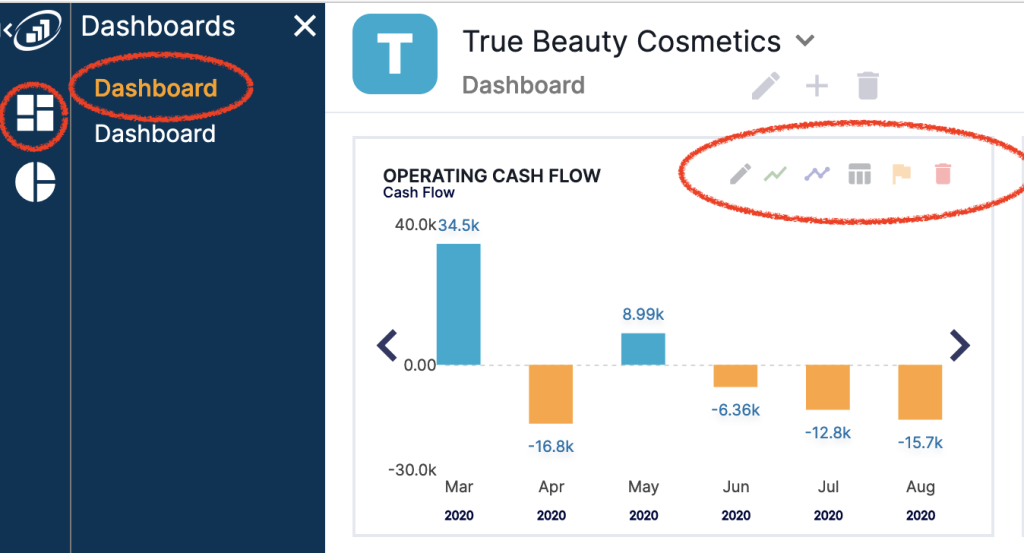
Navigate to any Dashboard to follow along, and find the tile menu at the top of any tile:
Edit Tile Tool
This tool allows you to select any item from your financials and display it graphically. Trying to decide what to put in your dashboard? Our blog on Key Performance Indicators is a good place to start!
Budget Tool
This tool allows you to turn on the comparison to budget feature. This will add a dark blue line to this chart and allow you to compare historic data with the budget you have set as default. Note, this feature will only work if you have published a budget.
Chart Style Tool
This tool allows you to select the format of the chart, either a line chart with no numbers displayed or a bar chart with numbers.
Go To Source Tool
This tool allows you to go to the source of the information in your chart. If budget comparison is turned off, clicking this button will direct you to the historical financial report the information in your chart is related to and highlight that line item on the report. If budget is turned on, this button will direct you to the comparison report and highlight the line item from the chart on that report.
Alert Tool
In a later version of AutoCFO, this tool will allow you to turn on an email alert to send you this chart via email at your preferred frequency.
Delete Tool
This tool allows you to delete a chart, there are a maximum of 9 charts per dashboard and a maximum of 5 dashboards.
Add a Chart Tool
This tool allows you to add a chart to your dashboard, there are a maximum of 9 charts per dashboard and a maximum of 5 dashboards.