Can you export a chart into PowerPoint?
Not at this time, we recommend the snipping tool from Microsoft or another screen capture tool. Alternatively, why not just share the dashboard screen with the team instead? It’s already beautifully formatted and you can save the “build and tweak a PowerPoint for 5 hours” step!
What should I use the dashboard for?
Great question! We recommend setting up a few different dashboards depending on the priorities of your business.
Focused on revenue growth?
Create a dashboard focused on your different revenue streams, sales, marketing, and ad spend! Select each of these items from the income statement section in the edit tool. If you’d like to see some of those expense items grouped together, head over to the report editor to consolidate accounts.
Focused on watching costs?
Create a dashboard covering the major expenses for your business is watching, this may be a good time to consolidate a few of your expenses into groups so that you can more easily track them (maybe makes a group called sales and marketing and put all marketing, sales, travel and entertainment and other related expenses in this group).
Focused on cash?
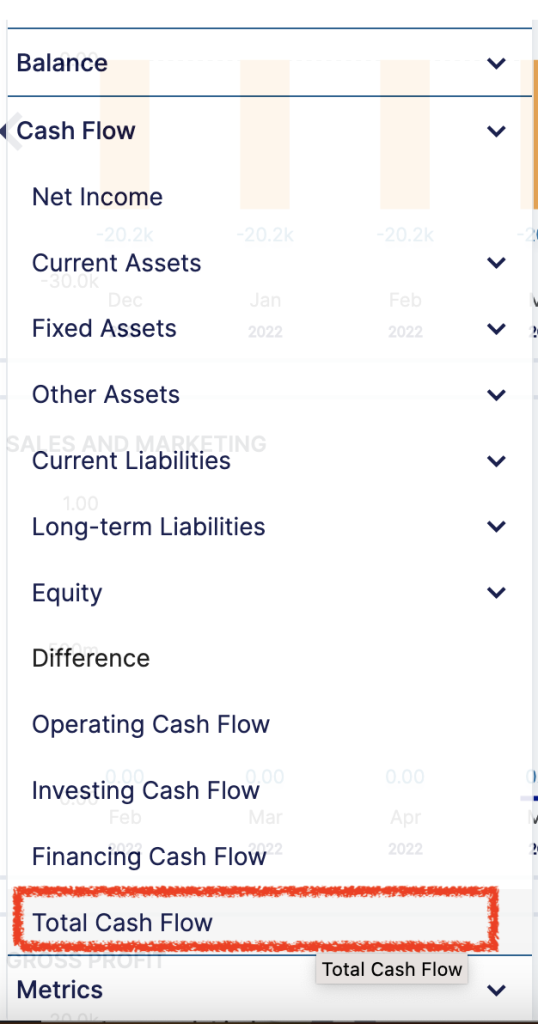
Look for the “total cash flow” option under the cash flow section for the net change in cash each month.
Next select track cash balance by finding the cash portion of your balance sheet (it is often called “cash” or “bank accounts” and located under current assets in the balance sheet section.
Look for the “total cash flow” option under the cash flow section for the net change in cash each month.
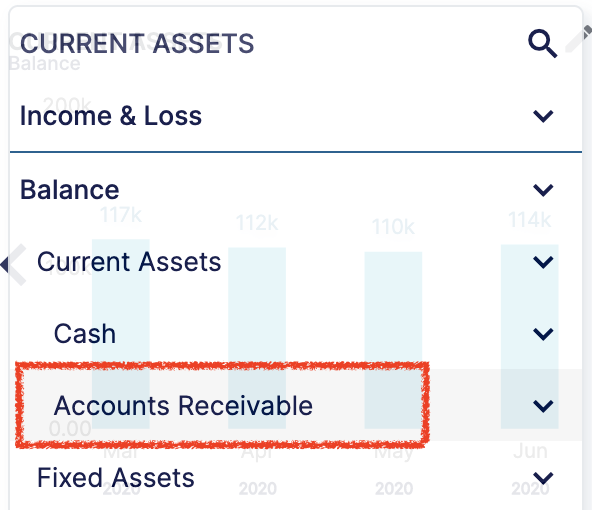
You might also want to track “accounts receivable” if you invoice your clients and are looking for ways to increase cash (usually this one is located under balance sheet -> Current assets then called “accounts receivable” or “AR”)
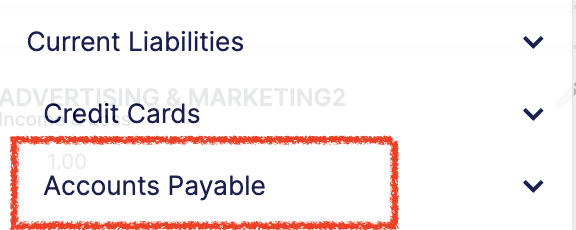
It is also good to track accounts payable, this helps you understand if an increase in cash is a short term increase (you still owe a vendor a lot of money) until you make certain payments (usually this one is located under balance sheet -> Current liabilities then called “accounts payable” or “AP”)
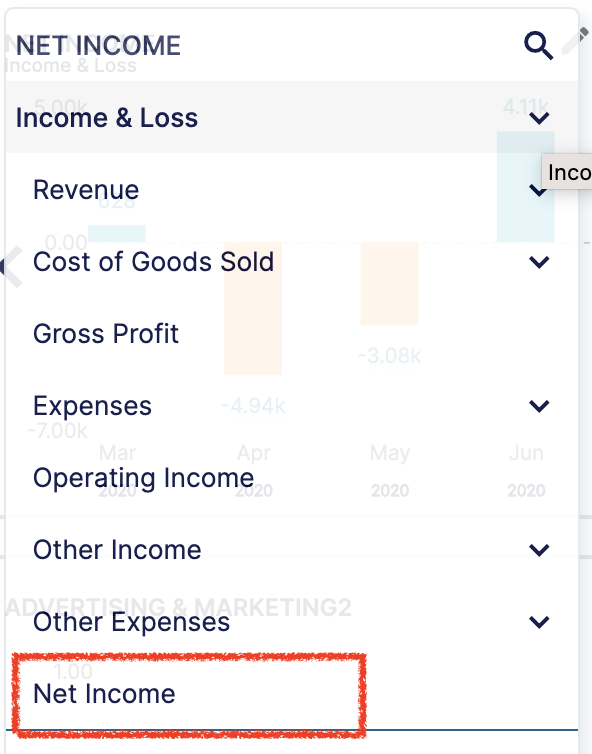
Net Income can also be useful to add to this dashboard. Net income is the measurement of your business's profit (or loss), it is also called earnings. It shows how much cash your business would receive in a time period if your customers paid immediately, you paid all of your vendors immediately and you were able to make large purchases (new desks for the office) in payments over several months versus all at once. Often people confused net income with cash low, and that leads to the question, if my business has positive net income (profit), why do I have less cash than before? The most common places to look for “cash drain” are costs that you have to pay quickly (payroll and accounts payable) or customers that pay slowly (this will show up as accounts receivable typically).
If you really want to dig into how accounts payable and accounts receivable are affecting your cash flow, you can add the change in cash for each of these accounts to this dashboard, they should be located under Cash flow from operations -> Adjustments to reconcile Net Income to Net cash from operations -> Look for “accounts receivable” and “accounts payable” in this section